Excel-Style Spreadsheets for Qlik
Add spreadsheet power to your dashboards with live Qlik data in an Excel-like interface
Add spreadsheet power to your dashboards with live Qlik data in an Excel-like interface
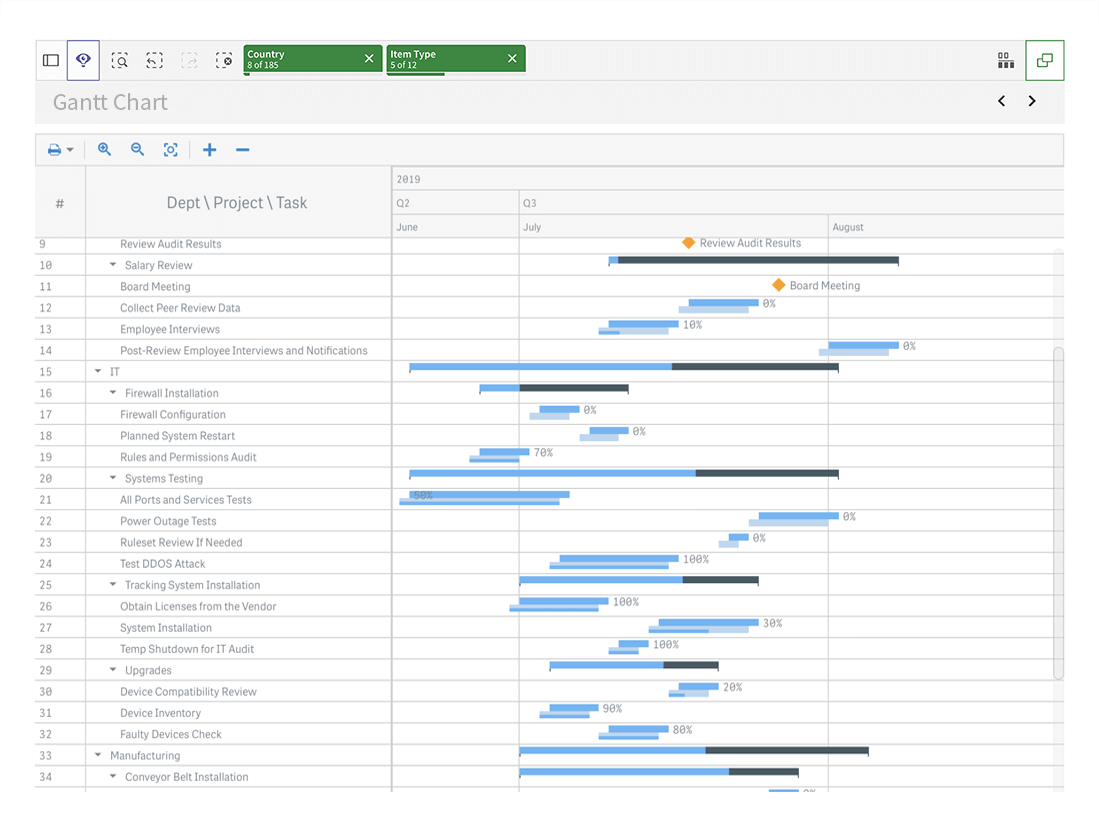
Intellectualize project management by visualizing tasks and resources
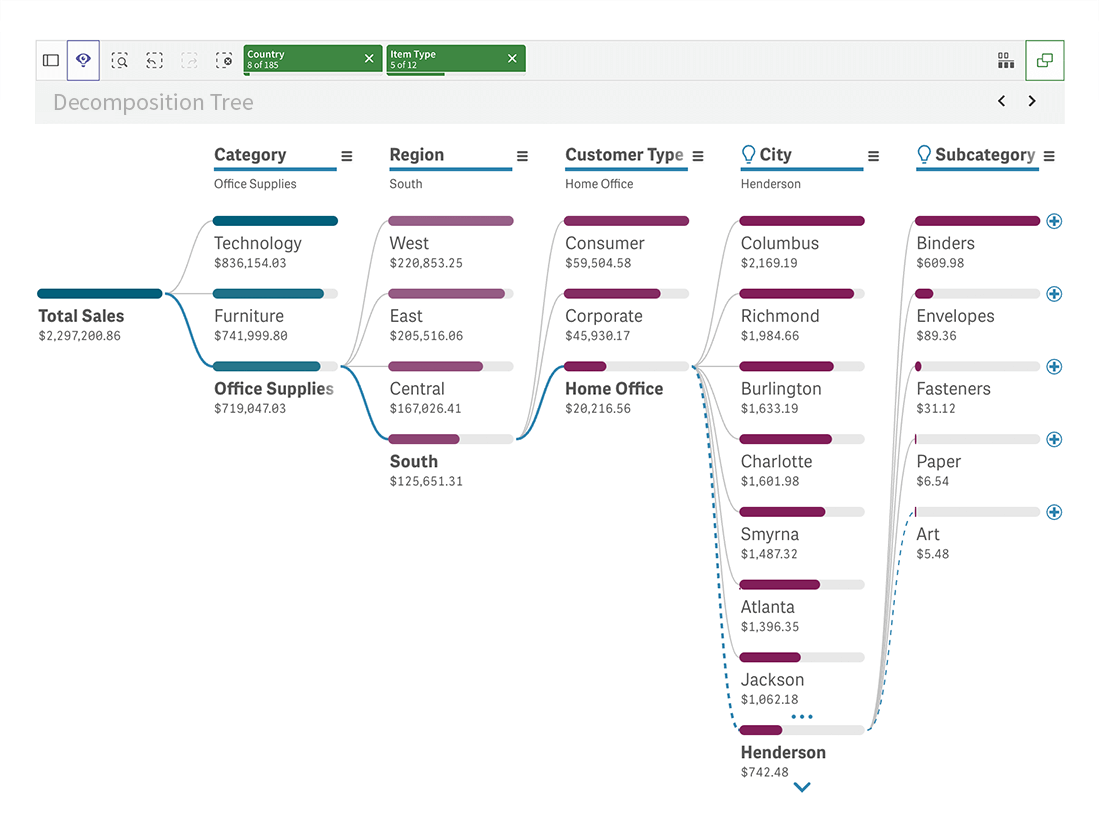
Empower root cause analysis by breaking down data hierarchies on the fly
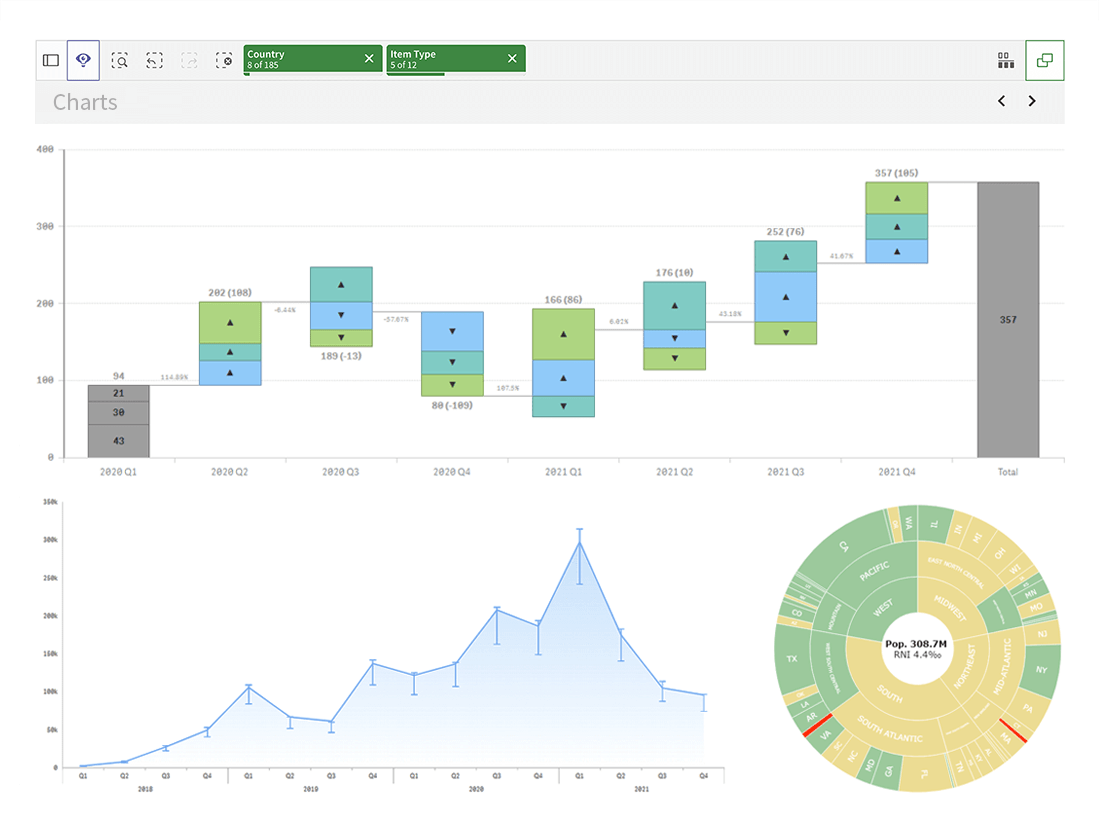
Streamline smart decision-making by letting your data speak, with ease
 Introducing Spreadsheets Extension for Qlik Sense!
Excel-like UI, formulas, charts, export, import, and more.
Introducing Spreadsheets Extension for Qlik Sense!
Excel-like UI, formulas, charts, export, import, and more.
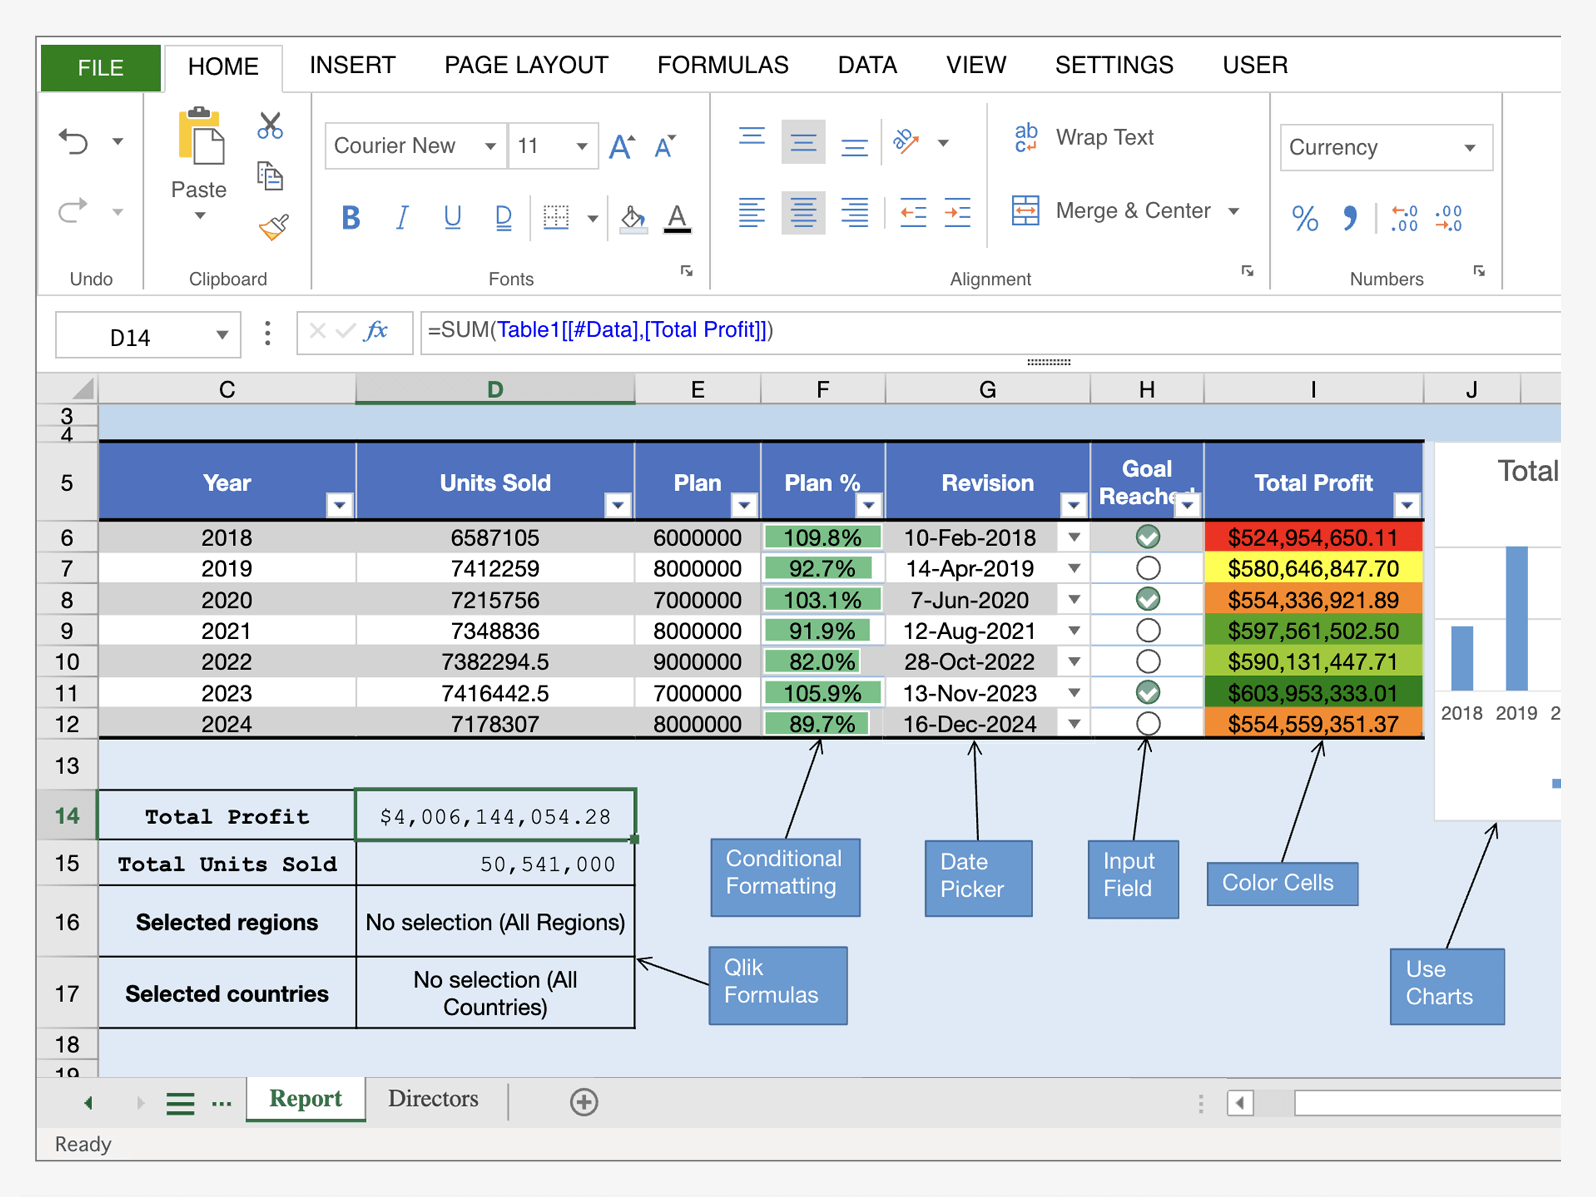
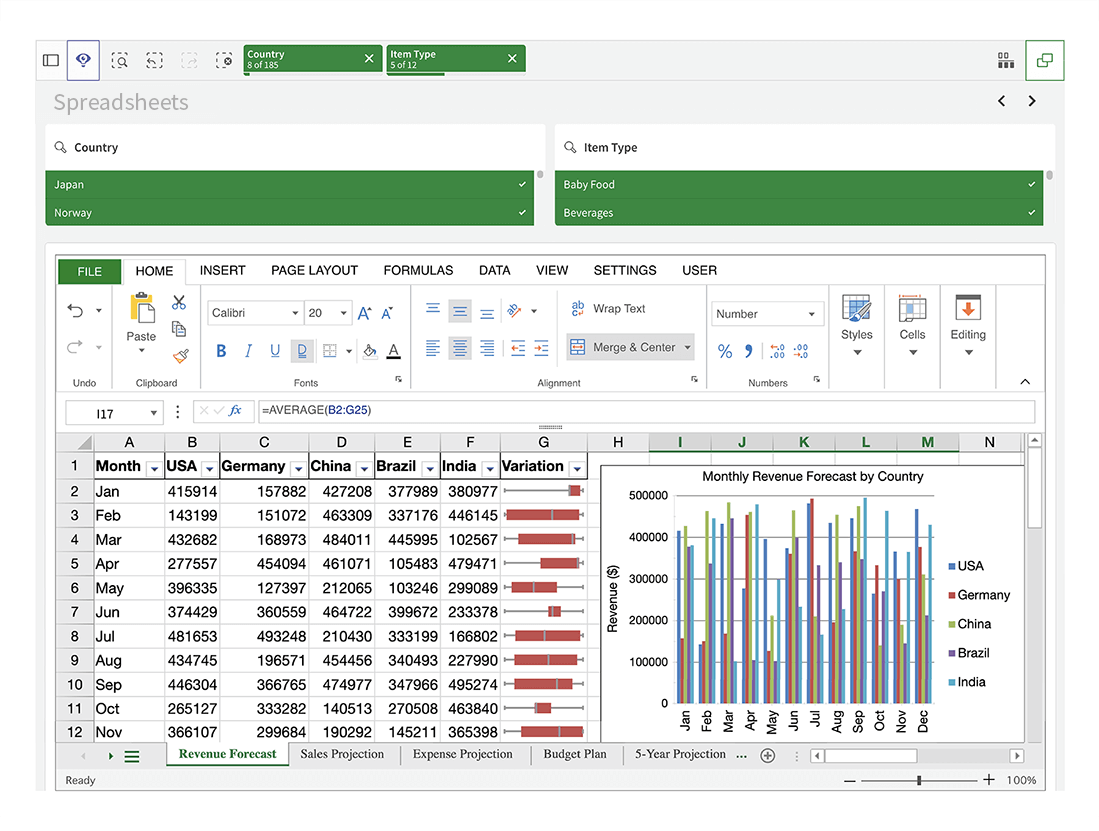
Microsoft Excel set the standard for working with structured data. The Spreadsheets extension for Qlik Sense brings that familiar power straight into your dashboards, letting users view, edit, and analyze live Qlik data in a tabular interface they already know — with zero learning curve.
Users can intuitively sort and filter data, apply formulas and functions, customize formatting and layout, build charts in-sheet, search, freeze rows, use keyboard shortcuts, and more — just like in Excel.
Combining simplicity and flexibility, the Spreadsheets extension supports everything from reporting to hands-on data exploration. Use it standalone or embed it alongside visualizations to enrich your Qlik apps with trusted spreadsheet experience.
SEE SPREADSHEETS FOR QLIK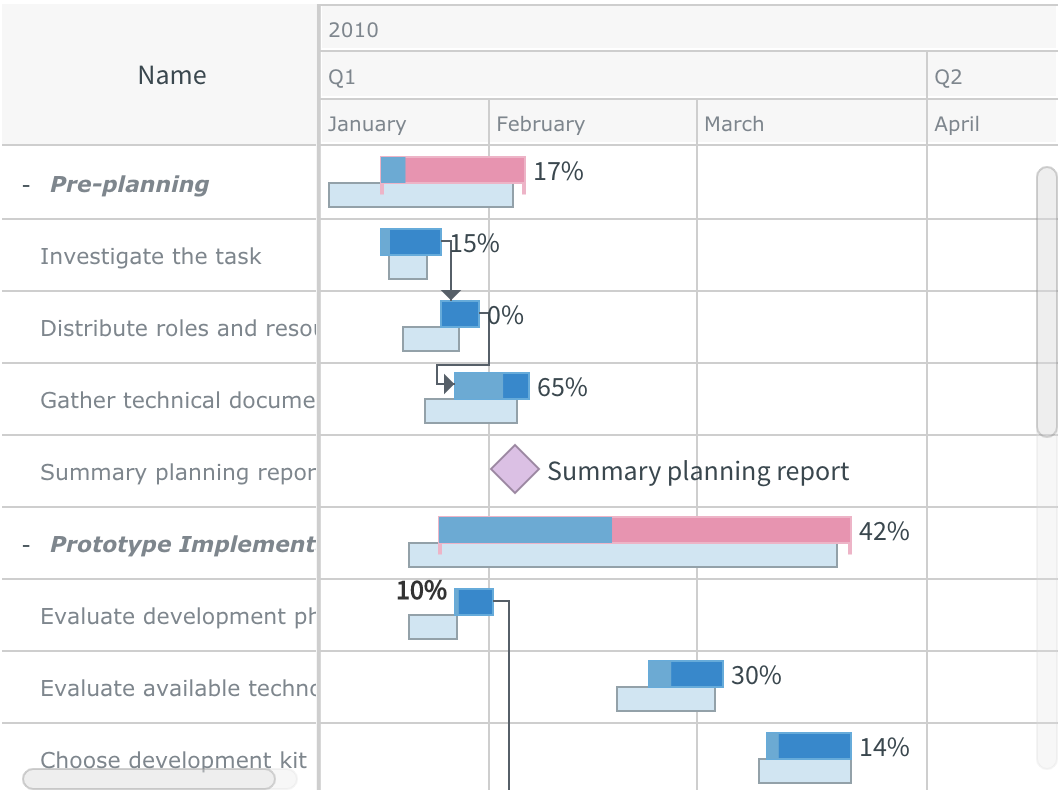
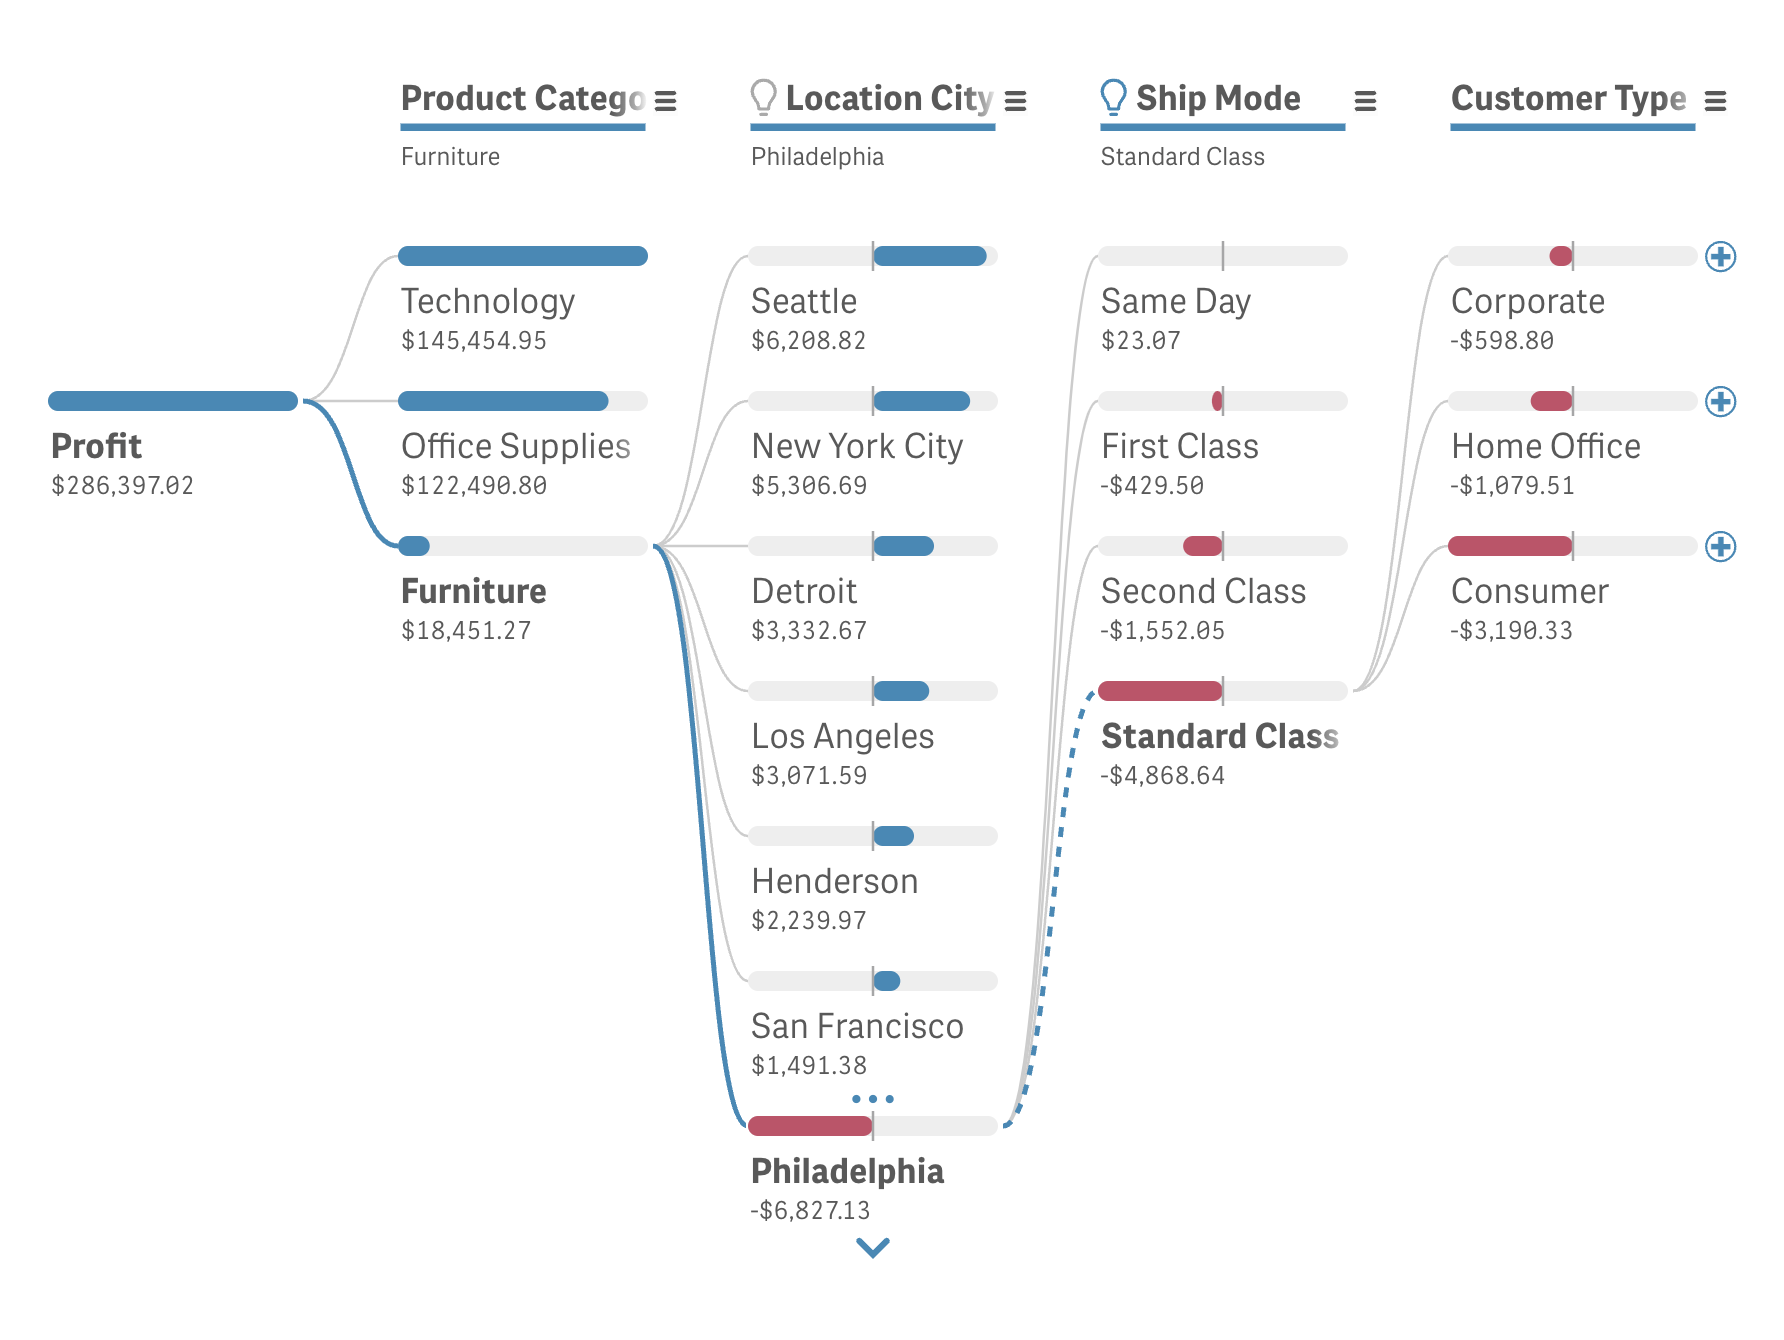
The decomposition tree visual provides a granular view of core metrics by splitting them into multiple dimensions. It enables intuitive root cause analysis and in-depth ad hoc data exploration on a single sheet to reveal key impact factors — now automatically with AI Splits — to optimize performance (and profits). The Decomposition Tree extension for Qlik Sense is a cutting-edge tool to create elegant decomposition trees in just a few clicks, with the ease one has come to expect from Qlik.
Choose the order of dimensions in a breakdown or let users decide which dimension to drill down into next. Apply conditional coloring for at-a-glance insights. Add multiple measures for comprehensive analysis. Set the desired view mode and paging to ensure a perfect fit in your BI dashboard.
SEE DECOMPOSITION TREE FOR QLIK